Current Ozone Activity
2022 Ozone Days Calendar - Current Design Value is: 77 ppb
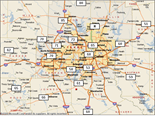
Current Air Quality Index (AQI) Map
These are not monitor values. These are AQI values. See table below. |
|
Air Quality Index Values and Ozone Concentration
Air Quality Index(AQI) Values |
8-hour Ozone Levels (ppb) |
Levels of Health Concern |
Colors |
0-50 |
0-54 |
Good |
Green |
51-100 |
55-70 |
Moderate |
Yellow |
101-150 |
71-85 |
Unhealthy for Sensitive Groups |
Orange |
151 to 200 |
86-105 |
Unhealthy |
Red |
201 to 300 |
106-200 |
Very Unhealthy |
Purple |
301 to 500+ |
Not Defined |
Hazardous |
Maroon |
Current AQI Animation Animation Courtesy of
AirNow
Monitor values shown on map are AQI values, not hourly ozone measurements. See AQI table above.
![Map shows the current highest ozone 1-hour levels measured in parts per billion for each of the metropolitan areas in Texas where ozone is measured by the TCEQ.](/getmedia/fa494273-444e-444e-8007-9c5f7e8adc9d/tceq-monitor-map.png.aspx?width=155&height=116) |
![2022 Calendar for Air Quality Purposes](/getmedia/e5303189-d0d7-4a30-a4a0-bdbc12186620/AqCalendar22.png.aspx?width=110&height=110) |
![small thumbnail of multicolored score card showing various levels of ozone alert colors and levels as an example includes a link to last exceedance scores](/getmedia/60495ad0-66fb-4c40-bffa-a6eeb4c30c3c/AQIwidget_002.jpg.aspx?width=129&height=97) |
![If the PDF doesn't appear use the Ctrl/Cmd + J to view your download This is a thumbnail of a generic line chart linking to the 8-hour ozone NAAQS historical trends as of June 14, 2021 outlining the standards of 1997, 2008, and 2015.](/getmedia/af2b9aa0-9f02-4f3c-b8c6-6ac4f5446ae8/Trend-Line-widget_jpl.jpg.aspx?width=129&height=97) |
![This is a thumbnail of an example air quality index chart which links to the Texas Commission on Environmental Quality website displaying the air quality forecast for the day.](/getmedia/657af773-b82e-485d-aded-bfd4aeea8915/TCEQAQForecast2.jpg.aspx?width=128&height=96) |
TCEQ Map of Current Monitor Levels
|
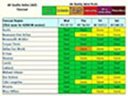
2022 Ozone Season Calendar
Current as of
9/6/2022
|
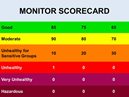
Ozone Monitor Scorecard
Current as of
9/6/2022
|
Ozone Design Value Trendlines (Historical and Current)
Current as of
9/6/2022
|
TCEQ Air Quality Forecast
|
Sign up for air pollution alerts and learn how you can help improve air quality at www.AirNorthTexas.org.
![Air North Texas Logo a blue circle with waves in the middle and Air North Texas text around the bottom linking to the Air North Texas site.](/getmedia/f35f513b-3405-41ff-a51b-a87805cf38ee/antx_RGB.jpg.aspx?width=200&height=190)
Please contact Jenny Narvaez with any other questions.