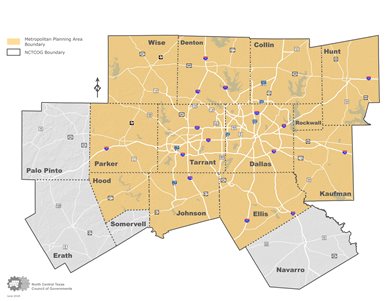
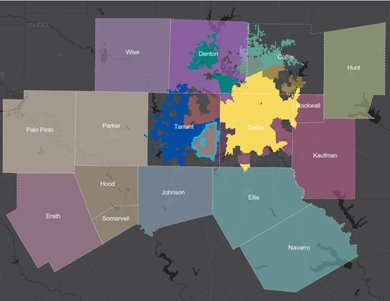
| NCTCOG Region and Metropolitan Planning Area (PDF) |
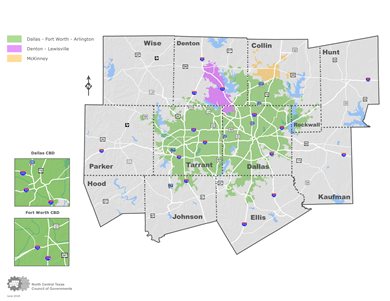
Urbanized Areas (PDF) |
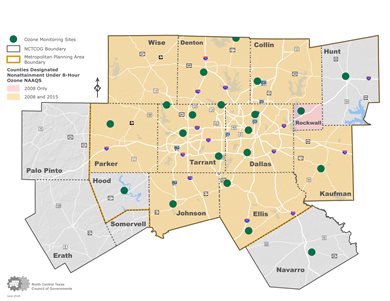
Nonattainment Areas (PDF) |
 |
 |
 |
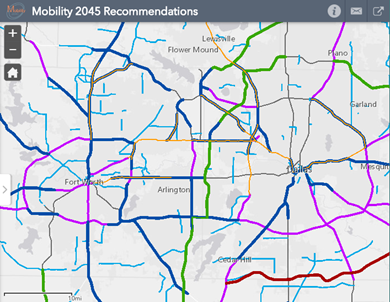
| Mobility 2045 Recommendations |
Mobility 2045 Fact Sheets |
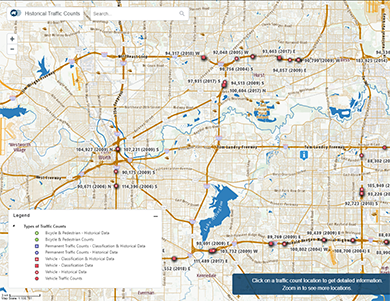
Historical Traffic Counts |
 |
 |
 |
| Environmental Justice Index |
Transit Accessibility Improvement Tool |
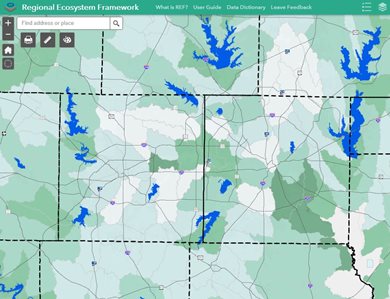
Regional Ecosystem Framework |
 |
.PNG.aspx?width=390&height=305 "Screenshot-(1).PNG") |
 |
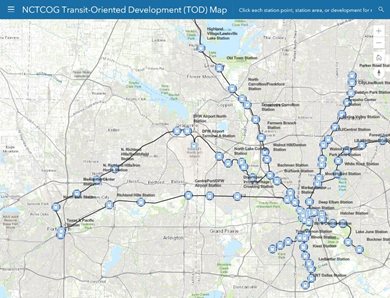
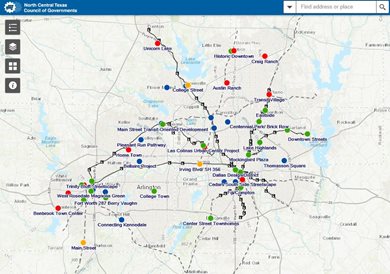
| Transit-Oriented Development |
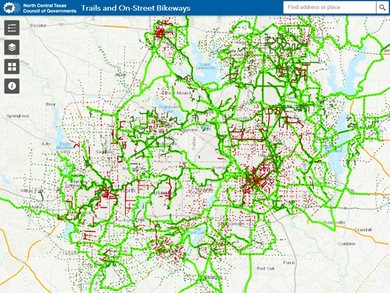
Trails and On-Street Bikeways Network |
Sustainable Development Infrastructure |
 |
 |
 |
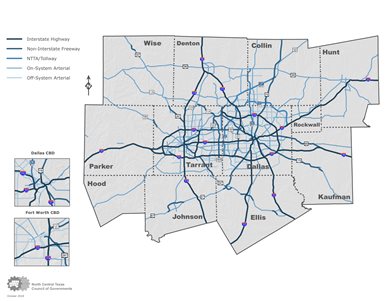
| National Highway System (PDF) |
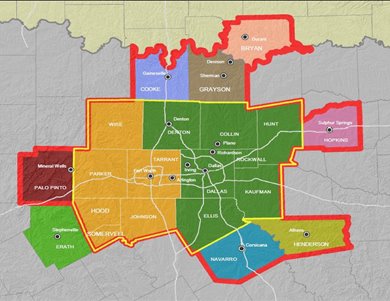
Metropolitan and Micropolitan Statistical Areas (PDF) |
Public Transportation Provider Service Areas |
 |
 |
 |
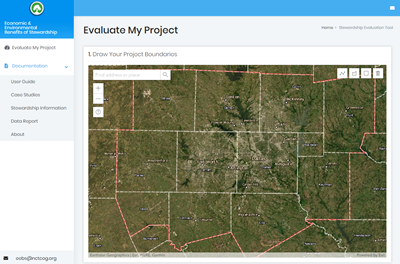
| Economics & Environmental Benefits of Stewardship |
Travel Time Contour Maps |
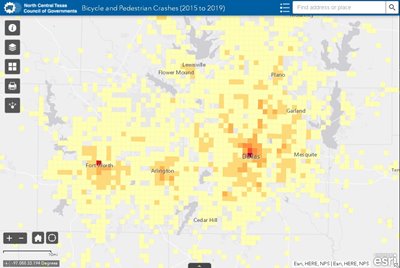
Bike and Pedestrian Crashes (2016-2020) |
 |
 |
 |